


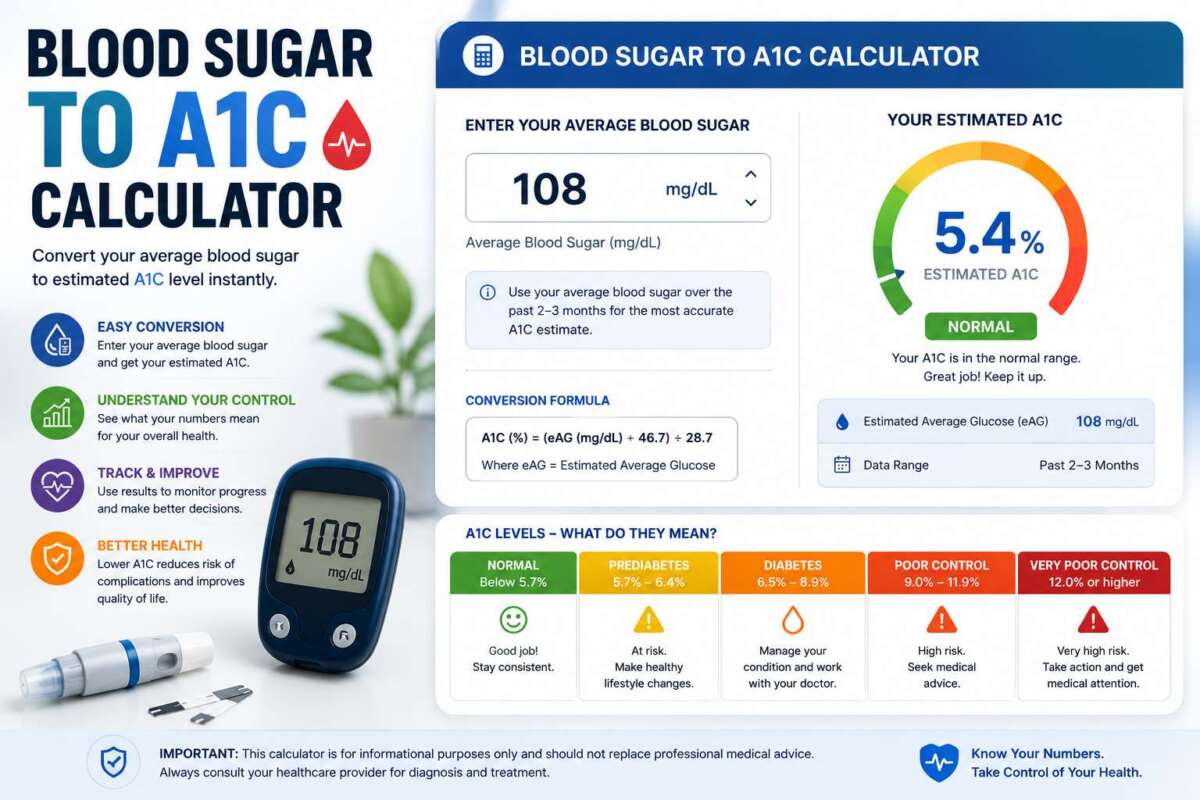
Important: This tool is for educational purposes only and is not a substitute for a laboratory A1C test or medical advice. A1C is a clinical blood test reflecting roughly 2-3 months of average blood sugar — it cannot be accurately determined from home glucose readings alone. Always follow up with your healthcare provider for diagnosis, monitoring, and treatment decisions.
The Blood Sugar to A1C Calculator uses the ADA-endorsed formula linking A1C to Estimated Average Glucose (eAG). Use the A1C to eAG tab to convert a known A1C result into an average glucose figure, the Average Glucose to A1C tab to get a rough estimate in the other direction, or the A1C Change Tracker tab to see how much two A1C readings differ over time.
Table of Contents
- Blood Sugar to A1C Calculator
- What Is A1C and eAG?
- The A1C-to-eAG Formula Explained
- A1C Categories
- Why Home Monitoring Averages Differ from Lab eAG
- Limitations and Conditions That Affect A1C Accuracy
- Frequently Asked Questions
Blood Sugar to A1C Calculator
Select a tab below. All conversions use the ADA-endorsed ADAG study formula linking A1C and estimated average glucose.
What Is A1C and eAG?
A1C (also called HbA1c or hemoglobin A1c) is a blood test that measures the percentage of hemoglobin proteins in red blood cells that have glucose attached to them. Because red blood cells live for roughly 2-3 months, A1C reflects an average of blood sugar levels over that period, rather than a single point-in-time reading like a fingerstick glucose test. Estimated Average Glucose (eAG) translates that A1C percentage into a glucose number in the same units (mg/dL or mmol/L) used by everyday glucose meters, making the result more intuitive to compare against daily readings.
The A1C-to-eAG Formula Explained
This calculator uses the formula from the ADAG (A1C-Derived Average Glucose) study, endorsed by the American Diabetes Association:
eAG (mg/dL) = 28.7 × A1C (%) − 46.7
To convert to mmol/L, divide the mg/dL result by 18.0182. The reverse calculation (average glucose to A1C) simply solves the same equation for A1C: A1C = (eAG + 46.7) ÷ 28.7.
A1C Categories
- Normal: Below 5.7%
- Prediabetes: 5.7% to 6.4%
- Diabetes range: 6.5% or higher
These are the standard ADA diagnostic categories. A single A1C result is typically confirmed with a repeat test or additional criteria before a formal diagnosis is made — this calculator’s category label is for general reference only and is not a diagnosis.
Why Home Monitoring Averages Differ from Lab eAG
The ADAG formula was derived by correlating lab A1C results with average glucose measured through frequent or continuous glucose monitoring — capturing readings around the clock, including overnight and between-meal periods most people don’t manually check. A simple average of scattered fingerstick readings (often concentrated around meals, when levels tend to be less extreme than fasting or post-meal peaks might suggest) can diverge meaningfully from a true 24-hour average, which is why the Average Glucose to A1C tab’s estimate should be treated as rough guidance rather than a reliable stand-in for an actual lab test.
Limitations and Conditions That Affect A1C Accuracy
A1C results can be affected by conditions unrelated to average blood sugar, including certain anemias, hemoglobin variants, recent significant blood loss or transfusion, pregnancy, and some chronic kidney or liver conditions — in these situations, A1C may not accurately reflect true average glucose, and a healthcare provider may use alternative testing methods. This calculator performs only the standard population-level conversion math and cannot account for any of these individual factors.
Frequently Asked Questions
Can I use my home glucose meter average instead of getting an A1C test?
No. A home meter average, especially from limited manual checks, is not an accurate substitute for a laboratory A1C test. A1C captures continuous glucose exposure over months, including times you’re unlikely to test manually, and is the standard clinical measure used for diagnosis and monitoring.
Why do two people with the same average blood sugar sometimes have different A1C results?
Individual variation in red blood cell lifespan and glycation rates means the population-average ADAG formula doesn’t fit every individual with identical precision — most people’s actual A1C falls close to the formula’s prediction, but some individual variability is expected and normal.
How often should A1C be tested?
Testing frequency depends on individual circumstances and is a decision for your healthcare provider — common general patterns include roughly twice yearly for people with well-controlled diabetes and more frequently when treatment is being adjusted, but your provider’s specific recommendation should always take precedence over any general guideline.
Is a lower A1C always better?
Not necessarily for everyone — while lower A1C generally indicates better average blood sugar control, individualized A1C targets can vary based on age, other health conditions, and hypoglycemia risk, particularly for older adults or those with certain medical histories. Target A1C is a personalized decision made with a healthcare provider, not a single universal number.
As an Amazon Associate, We earn from qualifying purchases. When you purchase a product through Amazon links on pulsefitguide.com, we may earn a small commission at no extra cost to you. This helps support the site and keep our content free.
