


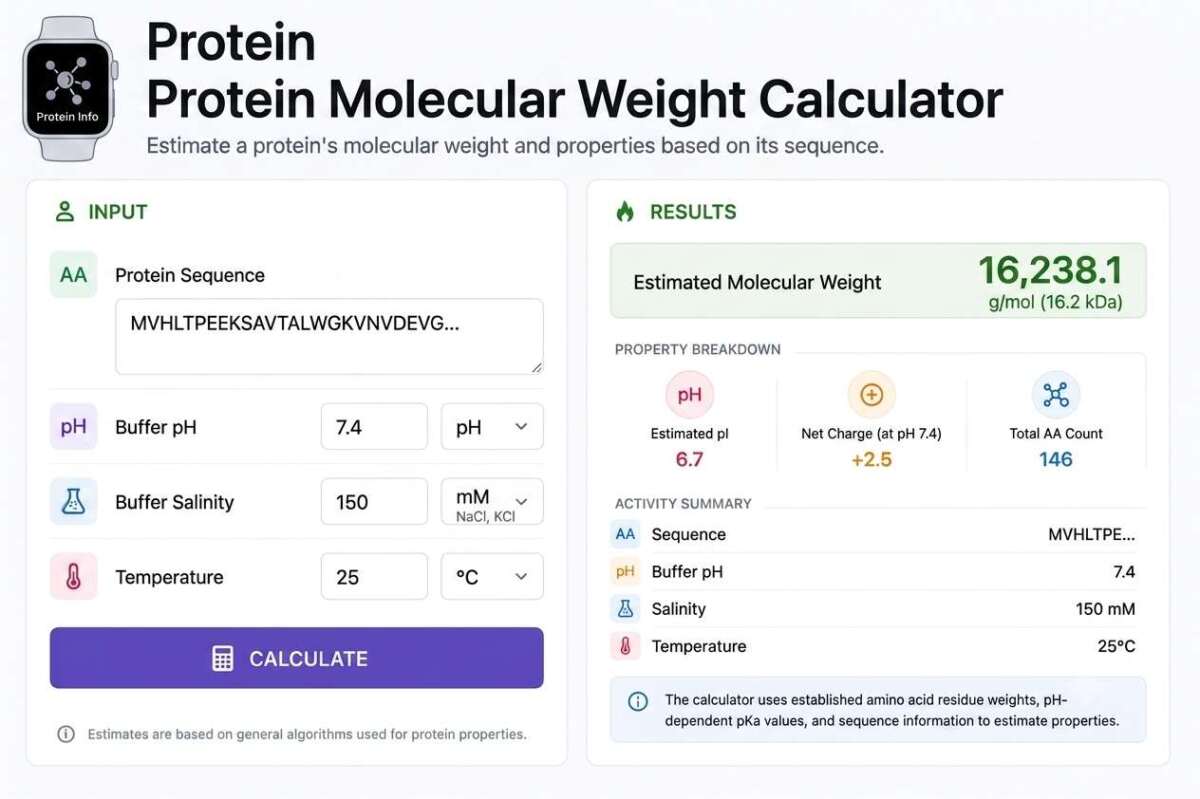
The Protein Molecular Weight Calculator computes a protein’s molecular weight directly from its amino acid sequence, using the same average residue mass method behind standard bioinformatics tools like ExPASy’s ProtParam. It also calculates the extinction coefficient at 280nm for concentration determination by UV absorbance, and gives a full amino acid composition breakdown.
Use the Molecular Weight tab to compute MW from a sequence, the Extinction Coefficient tab to calculate ε280 and protein concentration from an A280 reading, or the Amino Acid Composition tab to see a full residue breakdown — instantly.
Table of Contents
- Protein Molecular Weight Calculator (Free Tool)
- How Protein Molecular Weight Is Calculated
- Average Mass vs. Monoisotopic Mass
- Calculating the Extinction Coefficient (ε280) and Concentration
- Amino Acid Composition and Classification
- Limitations: Modifications and Non-Standard Residues
- Frequently Asked Questions
Protein Molecular Weight Calculator
Select a tab below to compute molecular weight, extinction coefficient and concentration, or amino acid composition. Paste a sequence using standard single-letter amino acid codes.
| AA | Count | % | AA | Count | % |
|---|
How Protein Molecular Weight Is Calculated
A protein’s molecular weight is the sum of its constituent amino acid residue masses, plus one water molecule:
Molecular Weight = Σ(Residue Masses) + 18.02 Da
Each peptide bond formed between two amino acids releases one water molecule (a condensation reaction), so the “residue mass” of each amino acid in a chain is its free amino acid mass minus water. Summing residue masses across the whole chain accounts for every internal peptide bond, but the two chain ends (the free N-terminal amino group and free C-terminal carboxyl group) still need that one water molecule’s worth of mass added back — which is why the formula adds 18.02 Da exactly once, regardless of how long the protein is.
Average Mass vs. Monoisotopic Mass
This calculator uses average isotopic mass — the residue mass weighted by each element’s natural isotopic abundance, which is the appropriate figure for most everyday lab purposes (estimating a band’s position on an SDS-PAGE gel, general protein characterization, dilution calculations). Monoisotopic mass — calculated using only the most abundant isotope of each element — is the figure used in mass spectrometry, where instruments resolve individual isotope peaks and need the exact mass of a single isotopic species rather than a weighted average. For most proteins, the difference between average and monoisotopic mass is small in relative terms but matters a great deal for interpreting high-resolution MS data correctly.
Calculating the Extinction Coefficient (ε280) and Concentration
Most proteins absorb UV light at 280nm primarily because of their tryptophan and tyrosine content (with a smaller contribution from cystine, the oxidized disulfide-bonded form of cysteine). The widely used Pace/Gill-von Hippel formula estimates a protein’s molar extinction coefficient directly from its sequence composition:
ε280 (M⁻¹cm⁻¹) = (Trp count × 5,500) + (Tyr count × 1,490) + (Cystine count × 125)
Because it’s often unknown from sequence alone how many cysteine pairs actually form disulfide bonds (cystine) versus remaining reduced, the Extinction Coefficient tab above lets you compute both scenarios. Once you have ε280, the Beer-Lambert law converts a measured absorbance reading directly into protein concentration:
Concentration (M) = Absorbance ÷ (ε280 × Path Length)
This is one of the most common quick protein quantification methods in a molecular biology lab, since it requires only a UV spectrophotometer reading and the protein’s known sequence — no additional reagents or standard curve needed, unlike colorimetric assays (Bradford, BCA).
Amino Acid Composition and Classification
Beyond total molecular weight, a sequence’s amino acid composition offers useful clues about a protein’s likely behavior — a high proportion of hydrophobic residues can suggest membrane association or a tendency toward aggregation in aqueous buffer, while the balance of acidic (Asp, Glu) versus basic (Lys, Arg, His) residues shapes the protein’s overall charge and influences its isoelectric point and behavior in ion-exchange chromatography or gel electrophoresis under native conditions.
These classifications are useful general heuristics rather than precise biochemical categories — a handful of residues (glycine, proline, histidine in particular) have properties that don’t fit neatly into a simple hydrophobic/polar/charged scheme, and different references classify them slightly differently.
Limitations: Modifications and Non-Standard Residues
- Post-translational modifications aren’t included: Glycosylation, phosphorylation, disulfide bond formation (which removes 2 hydrogens, slightly reducing mass), signal peptide cleavage, and other modifications all change a protein’s actual mass from the raw sequence-based calculation.
- Non-standard and ambiguous codes are excluded: This calculator recognizes the 20 standard amino acids only — characters like B (Asx), Z (Glx), X (unknown), U (selenocysteine), and O (pyrrolysine) are not counted, which will understate results for sequences containing them.
- This calculates the mass of the polypeptide chain alone: Any bound cofactors, metal ions, or non-protein prosthetic groups (heme, for example) add additional mass not captured by a sequence-only calculation.
For final, publication-quality molecular weight determinations — especially for a protein with known modifications — dedicated bioinformatics tools (like ExPASy ProtParam) or direct mass spectrometry measurement are the appropriate next step beyond this sequence-based estimate.
Frequently Asked Questions
Why is my calculated molecular weight different from what I see on a gel?
SDS-PAGE apparent molecular weight is an estimate based on migration distance relative to standards, and can be affected by a protein’s shape, charge, glycosylation, and other post-translational modifications — it commonly differs from the sequence-calculated mass by a meaningful margin, especially for heavily modified or unusually shaped proteins. The sequence-based calculation gives you the “true” unmodified polypeptide mass, which is a different (and often more accurate) number than gel migration alone suggests.
Why does the extinction coefficient calculation ask about disulfide bonds?
Cystine (the oxidized, disulfide-bonded form of two cysteine residues) contributes a small amount to UV absorbance at 280nm, while free reduced cysteine does not. Since sequence alone doesn’t reveal which cysteines are actually paired into disulfide bonds in the folded protein, the calculator lets you model both extremes so you can see the range of plausible ε280 values.
Can I use this for a protein with a His-tag or other fusion tag?
Yes — include the tag’s amino acid sequence directly in the sequence you paste in, and the calculator will include its residues in the total molecular weight, extinction coefficient, and composition results, exactly as it would for any other stretch of the sequence.
What if my protein has no tryptophan or tyrosine?
Its calculated ε280 will be zero (or very low, from cystine alone), meaning UV absorbance at 280nm isn’t a practical way to quantify that specific protein’s concentration — a colorimetric assay (Bradford, BCA, Lowry) or another quantification method would be more appropriate in that case.
Does this calculator account for the signal peptide or propeptide being cleaved?
No — it calculates the mass of exactly the sequence you enter. If you’re working with a mature, processed protein (after signal peptide cleavage or other proteolytic processing), paste only the mature sequence rather than the full precursor sequence to get an accurate result for the form you’re actually working with.
As an Amazon Associate, We earn from qualifying purchases. When you purchase a product through Amazon links on pulsefitguide.com, we may earn a small commission at no extra cost to you. This helps support the site and keep our content free.
